Metadata-Version: 2.1
Name: alive-progress
Version: 3.3.0
Summary: A new kind of Progress Bar, with real-time throughput, ETA, and very cool animations!
Home-page: https://github.com/rsalmei/alive-progress
Author: Rogério Sampaio de Almeida
Author-email: rsalmei@gmail.com
License: MIT
Keywords: progress,bar,progress-bar,progressbar,spinner,eta,monitoring,python,terminal,multithreaded,REPL,alive,animated,visual,feedback,simple,live,efficient,monitor,stats,elapsed,time,throughput
Platform: UNKNOWN
Classifier: Development Status :: 5 - Production/Stable
Classifier: Intended Audience :: Developers
Classifier: Environment :: Console
Classifier: Natural Language :: English
Classifier: License :: OSI Approved :: MIT License
Classifier: Programming Language :: Python :: 3
Classifier: Programming Language :: Python :: 3.9
Classifier: Programming Language :: Python :: 3.10
Classifier: Programming Language :: Python :: 3.11
Classifier: Programming Language :: Python :: 3.12
Classifier: Programming Language :: Python :: 3.13
Classifier: Programming Language :: Python :: 3.14
Requires-Python: >=3.9, <4
Description-Content-Type: text/markdown
License-File: LICENSE
Requires-Dist: about-time==4.2.1
Requires-Dist: graphemeu==0.7.2
[ ](https://www.buymeacoffee.com/rsalmei)
[
](https://www.buymeacoffee.com/rsalmei)
[ ](https://www.paypal.com/donate?business=6SWSHEB5ZNS5N&no_recurring=0&item_name=I%27m+the+author+of+alive-progress%2C+clearly+and+about-time.+Thank+you+for+appreciating+my+work%21¤cy_code=USD)

# alive-progress
[](https://gitHub.com/rsalmei/alive-progress/graphs/commit-activity)
[](https://pypi.python.org/pypi/alive-progress/)
[](https://pypi.python.org/pypi/alive-progress/)
[](https://pepy.tech/project/alive-progress)
[](https://pepy.tech/project/alive-progress)

Have you ever wondered where your lengthy processing was at, and when would it finish? Do you usually hit `RETURN` several times to make sure it didn't crash, or the SSH connection didn't freeze? Have you ever thought it'd be awesome to be able to _pause some processing_ without hassle, return to the Python prompt to manually fix some items, then _seamlessly resume_ it? I did...
I've started this new progress bar thinking about all that, behold the **alive-progress**! 😃
Introducing the newest concept in progress bars for Python! `alive-progress` is in a class of its own, with an array of cool features that set it apart. Here are a few highlights:
- A mesmerizing **live spinner** that reacts to your actual processing speed, i.e., it dynamically gets faster or slower with your throughput, and clearly shows a lengthy task is in progress, i.e., did not crash even if taking too long (and your SSH connection did not freeze if remote).
- An efficient **multithreaded** bar that updates itself at a fraction of the actual processing speed to keep **CPU usage low** and avoid terminal spamming (1,000,000 iterations per second equates to roughly 60 updates per second), and you can also calibrate it to your liking.
- An accurate **ETA** (Expected Time of Arrival) with an intelligent _Exponential Smoothing Algorithm_ that shows the time to completion, allowing you to plan your time and manage your workload more effectively.
- Automatic **print** and **logging** hooks that provide seamless and efortless integration with any code, even enriching these outputs with the current bar position when they occurred.
- It prints a nice **final receipt** when your processing ends, including the total items, the elapsed time, and the observed throughput.
- It detects **under** and **overflows**, enabling you to track hits, misses, or any desired counts, not necessarily the actually performed iterations.
- You can **suspend** it! That's right, you heard it here first! No other progress bar anywhere in any language has this feature! You can suspend your processing and get back to the Python prompt, adjust or fix some items, and then get back into the same processing as if it had never stopped!
- It is **highly customizable**, with a smorgasbord of ready-to-use spinner and bar styles, as well as several factories to easily create yours! There's even a super powerful `check()` tool that helps you design your own animations! You can see how the generated frames and animation cycles will look like, exploded on your screen, and even see it _alive_ before installing in `alive-progress`! It's the coolest tool in the world! Unleash your creativity!
---
## Table of contents
This README is always evolving, so do take a more comprehensive look from time to time... You might find great new details in other sections! 😊
* [alive-progress](#alive-progress)
* [Table of contents](#table-of-contents)
* [📌 What's new in 3.3 series](#-whats-new-in-33-series)
* [Previous releases](#previous-releases)
* [Using `alive-progress`](#using-alive-progress)
* [Get it](#get-it)
* [Try it](#try-it)
* [Awake it](#awake-it)
* [Master it](#master-it)
* [The `bar` handler](#the-bar-handler)
* [Auto-iterating](#auto-iterating)
* [Modes of operation](#modes-of-operation)
* [Auto and Unknown: Counter](#auto-and-unknown-counter)
* [Manual: Percentage](#manual-percentage)
* [Widgets available](#widgets-available)
* [The different `bar()` handler semantics](#the-different-bar-handler-semantics)
* [Styles](#styles)
* [Configuration](#configuration)
* [Create your own animations](#create-your-own-animations)
* [Intro: How do they work?](#intro-how-do-they-work)
* [A Spinner Compiler, really?](#a-spinner-compiler-really)
* [Spinner Factories](#spinner-factories)
* [Bar Factories](#bar-factories)
* [Advanced](#advanced)
* [The Pause Mechanism](#the-pause-mechanism)
* [Loop-less use](#loop-less-use)
* [FPS Calibration](#fps-calibration)
* [Forcing animations on PyCharm, Jupyter, etc.](#forcing-animations-on-pycharm-jupyter-etc)
* [Interesting facts](#interesting-facts)
* [To do](#to-do)
* [Python End of Life notice](#python-end-of-life-notice)
* [For Python 2.7 and 3.5](#for-python-27-and-35)
* [For Python 3.6](#for-python-36)
* [For Python 3.7 and 3.8](#for-python-37-and-38)
* [License](#license)
## 📌 What's new in 3.3 series
The latest `alive-progress` release is finally here, and it brings some exciting improvements! 🎉
Here's a summary of the most notable changes:
- Now the final receipt is available in the alive_bar handle, even after the bar has finished!
- This allows you to access the final receipt data and use it in your code, such as logging or displaying it in a custom way.
- You can change the bar title and text even after it has finished, so you can update the final receipt with new information or context.
- Included the elapsed time in the alive_bar handle, with full precision, so you can access the exact time it took to complete your processing.
Technical changes:
- Changed the `grapheme` dependency which was no longer maintained to `graphemeu`, which is a maintained fork of the original one.
- Added `py.typed` in the distribution to satisfy mypy and other type checking tools.
- Included Python 3.14 support (in CI for now).
### Previous releases
](https://www.paypal.com/donate?business=6SWSHEB5ZNS5N&no_recurring=0&item_name=I%27m+the+author+of+alive-progress%2C+clearly+and+about-time.+Thank+you+for+appreciating+my+work%21¤cy_code=USD)

# alive-progress
[](https://gitHub.com/rsalmei/alive-progress/graphs/commit-activity)
[](https://pypi.python.org/pypi/alive-progress/)
[](https://pypi.python.org/pypi/alive-progress/)
[](https://pepy.tech/project/alive-progress)
[](https://pepy.tech/project/alive-progress)

Have you ever wondered where your lengthy processing was at, and when would it finish? Do you usually hit `RETURN` several times to make sure it didn't crash, or the SSH connection didn't freeze? Have you ever thought it'd be awesome to be able to _pause some processing_ without hassle, return to the Python prompt to manually fix some items, then _seamlessly resume_ it? I did...
I've started this new progress bar thinking about all that, behold the **alive-progress**! 😃

Introducing the newest concept in progress bars for Python! `alive-progress` is in a class of its own, with an array of cool features that set it apart. Here are a few highlights:
- A mesmerizing **live spinner** that reacts to your actual processing speed, i.e., it dynamically gets faster or slower with your throughput, and clearly shows a lengthy task is in progress, i.e., did not crash even if taking too long (and your SSH connection did not freeze if remote).
- An efficient **multithreaded** bar that updates itself at a fraction of the actual processing speed to keep **CPU usage low** and avoid terminal spamming (1,000,000 iterations per second equates to roughly 60 updates per second), and you can also calibrate it to your liking.
- An accurate **ETA** (Expected Time of Arrival) with an intelligent _Exponential Smoothing Algorithm_ that shows the time to completion, allowing you to plan your time and manage your workload more effectively.
- Automatic **print** and **logging** hooks that provide seamless and efortless integration with any code, even enriching these outputs with the current bar position when they occurred.
- It prints a nice **final receipt** when your processing ends, including the total items, the elapsed time, and the observed throughput.
- It detects **under** and **overflows**, enabling you to track hits, misses, or any desired counts, not necessarily the actually performed iterations.
- You can **suspend** it! That's right, you heard it here first! No other progress bar anywhere in any language has this feature! You can suspend your processing and get back to the Python prompt, adjust or fix some items, and then get back into the same processing as if it had never stopped!
- It is **highly customizable**, with a smorgasbord of ready-to-use spinner and bar styles, as well as several factories to easily create yours! There's even a super powerful `check()` tool that helps you design your own animations! You can see how the generated frames and animation cycles will look like, exploded on your screen, and even see it _alive_ before installing in `alive-progress`! It's the coolest tool in the world! Unleash your creativity!
---
## Table of contents
This README is always evolving, so do take a more comprehensive look from time to time... You might find great new details in other sections! 😊
* [alive-progress](#alive-progress)
* [Table of contents](#table-of-contents)
* [📌 What's new in 3.3 series](#-whats-new-in-33-series)
* [Previous releases](#previous-releases)
* [Using `alive-progress`](#using-alive-progress)
* [Get it](#get-it)
* [Try it](#try-it)
* [Awake it](#awake-it)
* [Master it](#master-it)
* [The `bar` handler](#the-bar-handler)
* [Auto-iterating](#auto-iterating)
* [Modes of operation](#modes-of-operation)
* [Auto and Unknown: Counter](#auto-and-unknown-counter)
* [Manual: Percentage](#manual-percentage)
* [Widgets available](#widgets-available)
* [The different `bar()` handler semantics](#the-different-bar-handler-semantics)
* [Styles](#styles)
* [Configuration](#configuration)
* [Create your own animations](#create-your-own-animations)
* [Intro: How do they work?](#intro-how-do-they-work)
* [A Spinner Compiler, really?](#a-spinner-compiler-really)
* [Spinner Factories](#spinner-factories)
* [Bar Factories](#bar-factories)
* [Advanced](#advanced)
* [The Pause Mechanism](#the-pause-mechanism)
* [Loop-less use](#loop-less-use)
* [FPS Calibration](#fps-calibration)
* [Forcing animations on PyCharm, Jupyter, etc.](#forcing-animations-on-pycharm-jupyter-etc)
* [Interesting facts](#interesting-facts)
* [To do](#to-do)
* [Python End of Life notice](#python-end-of-life-notice)
* [For Python 2.7 and 3.5](#for-python-27-and-35)
* [For Python 3.6](#for-python-36)
* [For Python 3.7 and 3.8](#for-python-37-and-38)
* [License](#license)
## 📌 What's new in 3.3 series
The latest `alive-progress` release is finally here, and it brings some exciting improvements! 🎉
Here's a summary of the most notable changes:
- Now the final receipt is available in the alive_bar handle, even after the bar has finished!
- This allows you to access the final receipt data and use it in your code, such as logging or displaying it in a custom way.
- You can change the bar title and text even after it has finished, so you can update the final receipt with new information or context.
- Included the elapsed time in the alive_bar handle, with full precision, so you can access the exact time it took to complete your processing.
Technical changes:
- Changed the `grapheme` dependency which was no longer maintained to `graphemeu`, which is a maintained fork of the original one.
- Added `py.typed` in the distribution to satisfy mypy and other type checking tools.
- Included Python 3.14 support (in CI for now).
### Previous releases
New in 3.2 series
After about a year of reassuring stability, the new `alive-progress` has finally landed!
The main features and improvements are:
- The print/logging hooks now support multithreading => a highly requested feature: everything is synchronized now so you can print from different threads without issues! No more queues to send messages to the main thread!
- Rounded ETAs for long tasks => now the ETA automatically decreases its precision the higher it gets, making it smoother and easier to read!
- Support for zero and even negative bar increments => now on par with the manual mode, you can call `bar()` with `0` and even `-N` to make it go backwards! Useful when you couldn't make any progress in an iteration or had to roll back something!
And more!
- Custom offset for the enriched print/logging messages => now you can specify a custom `enrich_offset` to use for printed or logged messages, allowing you to start with `on 1:` or continue where you left from previous computations!
- Improved compatibility with PyInstaller => now custom bars, unknown bars, and spinners work when bundled!
- Improved compatibility with Celery => it will just work within Celery tasks!
- drop python 3.7 and 3.8, hello 3.12 and 3.13!
New in 3.1 series
A very cool update here! In addition to polishing things up and improving terminal support, now `alive-progress` supports resuming computations!
When processing huge datasets or things that take a long time, you might either use batches or cache partial results. Then, in case it stops and is restarted, you end up skipping all those already done items very quickly, which makes the `alive_bar` think you're processing thousands of items per second, which in turn completely ruins the ETA... But not anymore! Just tell `bar()` that you've skipped items... 👏
You can use it in two ways:
1. If you do know where you've stopped:
```python
with alive_bar(120000) as bar:
bar(60000, skipped=True)
for i in range(60000, 120000):
# process item
bar()
```
Yep, just call `bar(N, skipped=True)` once, with the number of items.
2. If you do not know or the items are scattered:
```python
with alive_bar(120000) as bar:
for i in range(120000):
if done(i):
bar(skipped=True)
continue
# process item
bar()
```
Yep, it's as simple as that! Just call `bar(skipped=True)` when an item is already done, or `bar()` as usual otherwise. You could also share a single `bar(skipped=?)` call at the end, with a bool saying whether you did skip that item or not. Cool, huh?
Also in this version:
- new `max_cols` config setting, the number of columns to use if not possible to fetch it, like in jupyter and other platforms which doesn't support size
- fix fetching the size of the terminal when using stderr
- officially supports Python 3.11
- included [ruff](https://github.com/charliermarsh/ruff) linter before building
New in 3.0 series
Yep, I could finally get this version out! These are the new goodies:
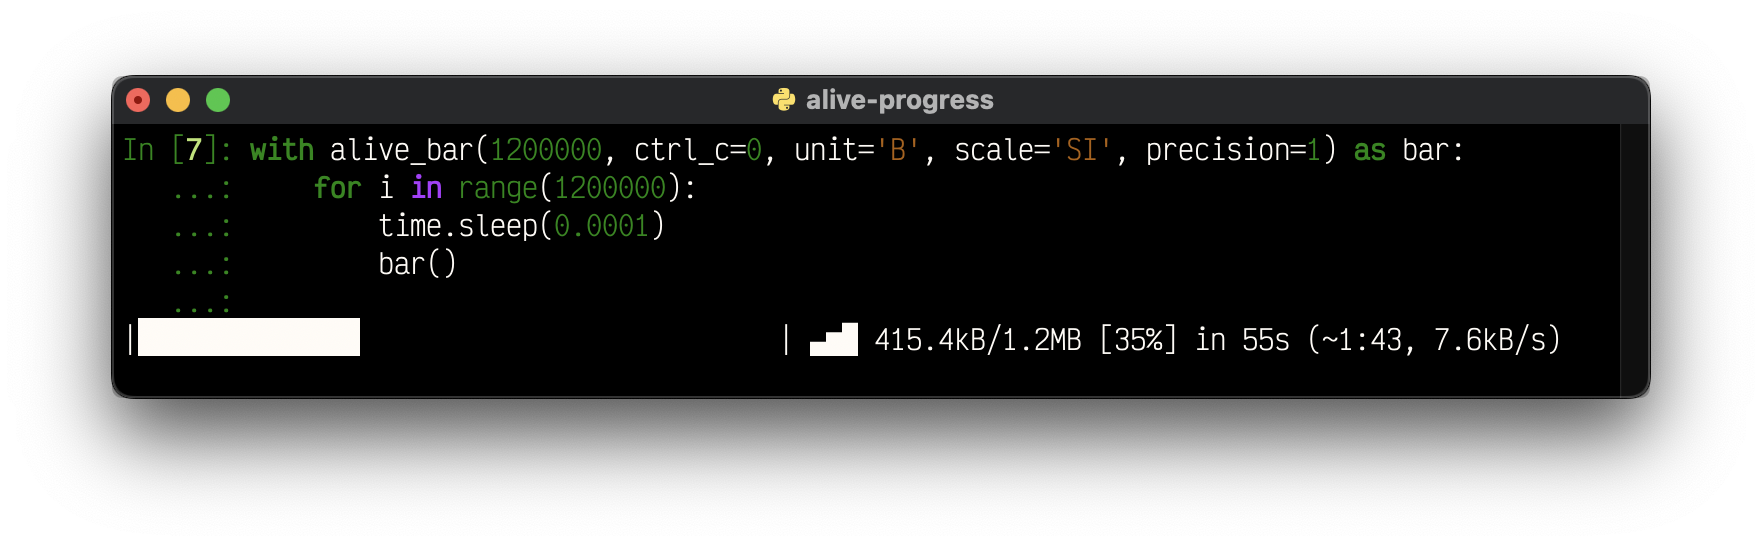
- Units support! You can now label the data you're processing, like `B`, `bytes`, or even `°C`!
- Automatic scaling! With support for SI (base 1000), IEC (base 1024), and even an alternate SI with base 1024, you'll be well served!
- Configurable precision! When your numbers are scaled, you get to choose how many decimals they display!
- Automatic stats scaling for slow throughputs! If your processing takes minutes or more, now you'll see rates per minute, per hour, and even per day! (It works within the auto-scaling system!)
- Support for using `sys.stderr` and other files instead of `sys.stdout`!
- Smoothed out the rate estimation with the same Exponential Smoothing Algorithm that powers the ETA, so the bar returns a more realistic ETA!
- Query the currently running widgets' data, like the monitor, rate, and ETA!
- New help system on configuration errors, which explains why a value was not accepted, and what were the expected ones!
Highly anticipated fixes:
- Support for reusing logging handlers! No more `TypeError: unhashable type: 'types.SimpleNamespace'`.
- Support for logging when using `RotatingFileHandler`s! Yep, seek support is here.
- Fix unknown mode always ending with a warning (!)
And last but not least, a more polished layout for you to enjoy your progress!
New in 2.4 series
Now, `alive_bar` supports *Dual Line* text mode!
If you ever wanted to include longer situational messages within the bar, you probably felt squeezed into one line. You had to shrink the beautifully animated bar or, even worse, remove widgets (!) to be able to see what you needed...
Not anymore!! You can now make the bar *Dual Line*, and put text below it!
Yes, there's a message below the whole bar, and any other print/logging messages scroll above it!
```python
letters = [chr(ord('A') + x) for x in range(26)]
with alive_bar(26, dual_line=True, title='Alphabet') as bar:
for c in letters:
bar.text = f'-> Teaching the letter: {c}, please wait...'
if c in 'HKWZ':
print(f'fail "{c}", retry later')
time.sleep(0.3)
bar()
```
Output:
```
on 7: fail "H", retry later
on 10: fail "K", retry later
Alphabet |███████████████████████████▊ | ▃▅▇ 18/26 [69%] in 6s (3.2/s, eta: 3s)
-> Teaching the letter: S, please wait...
```
There's also a new `finalize` function parameter in `alive_it` which enables you to set the title and/or text of the final receipt, and improved logging support which detects customized loggers.
New in 2.3 series
This is all about customization; the core widgets can now be changed:
- send a string to the `monitor`, `elapsed`, and `stats` widgets to make them look anyway you want!
> It's incredible that these strings support all Python format features, so you can e.g., `{percent:.1%}` 😉.
They can be further customized when on the **final receipt**!
- new `monitor_end`, `elapsed_end`, and `stats_end`, with dynamic formats inherited from the standard ones!
> If you've hidden some widgets before, just so they wouldn't appear on the receipt, now you can see them in all their running glory, and hide just the receipt ones! Or the other way around 😜
Another addition, now `alive-progress` beautifully renders its cool final receipt whenever it is stopped, even if you CTRL+C it prematurely! I don't know why I haven't thought about that before...
```
Download |██████████████████⚠︎ | (!) 45/100 [45%] in 4.8s (9.43/s)
```
And finally, you can choose to disable CTRL+C at all! The default is the safer `ctrl_c=True`, which does make CTRL-C work as usual.
Disable it `ctrl_c=False`, to make your interactive `alive_bar` much smoother to use (there are no stack traces if you stop it), and/or if it is at the top-level of your program!
> Beware: If it is e.g. inside a for-loop, it will just continue to the next iteration, which may or may not be what you want...
```python
for i in range(10):
with alive_bar(100, ctrl_c=False, title=f'Download {i}') as bar:
for i in range(100):
time.sleep(0.02)
bar()
```
Output:
```
Download 0 |████████▊⚠︎ | (!) 22/100 [22%] in 0.6s (36.40/s)
Download 1 |████████████████▊⚠︎ | (!) 42/100 [42%] in 1.0s (41.43/s)
Download 2 |██████▍⚠︎ | (!) 16/100 [16%] in 0.4s (39.29/s)
Download 3 |█████▋⚠︎ | (!) 14/100 [14%] in 0.4s (33.68/s)
Download 4 |█████████████▎⚠︎ | (!) 33/100 [33%] in 0.8s (39.48/s)
Download 5 |███████▎⚠︎ | (!) 18/100 [18%] in 0.5s (37.69/s)
Download 6 |█████▎⚠︎ | (!) 13/100 [13%] in 0.3s (37.28/s)
Download 7 |████████████⚠︎ | (!) 30/100 [30%] in 0.8s (38.43/s)
Download 8 |██████⚠︎ | (!) 15/100 [15%] in 0.4s (36.26/s)
...
```
New in 2.2 series
Some major new features, often requested, have finally landed!
- bar title can be dynamically set, changed, or even removed after being displayed
- new custom fps system, which enables very slow refresh rates (to let it run on those k8s for long periods)
- the final receipt can be totally hidden (great for special effects, like using the cool spinners standalone)
- new support for `click.echo()` printing
- terminal columns detection is safer for exotic environments
- requires Python 3.7+
New in 2.1 series
YES! Now `alive-progress` has support for Jupyter Notebooks and also includes a _Disabled_ state! Both were highly sought after, and have finally landed!
And better, I've implemented an auto-detection mechanism for jupyter notebooks, so it just works, out of the box, without any changes in your code!!
See for yourself:

> It seems to work very well, but at this moment, it should be considered **experimental**.
>
There were instances in which some visual glitches have appeared, like two `alive_bar` refreshes being concatenated together instead of over one another... And it's something I think I can't possibly work around: it seems Jupyter sometimes refresh the canvas at odd times, which makes it lose some data. Please let me know on the issues if something funnier arises.
New in 2.0 series
This is a major breakthrough in `alive-progress`!
I took 1 year developing it, and I'm very proud of what I've accomplished \o/
- now, there's complete support for Emojis 🤩 and exotic Unicode chars in general, which required MAJOR refactoring deep within the project, giving rise to what I called "**Cell Architecture**" => now, all internal components use and generate streams of cells instead of characters, and correctly interpret grapheme clusters — those so-called wide chars, which are encoded with a variable number of chars, but always take two cells on screen!! This has enabled us to render complex multi-chars symbols as if they were one, thus making them work on any spinners, bars, texts, borders and backgrounds, even when fractured!!! Pretty advanced stuff 🤓
- new super cool spinner compiler and runner, which generates complete animations ahead of time, and plays these ready-to-go animations seamlessly, with no overhead at all! 🚀
- the spinner compiler also includes advanced extra commands to generate and modify animations, like reshape, replace, transpose, or randomize the animation cycles!
- new powerful and polished `.check()` tools that compile and beautifully render all frames from all animation cycles of spinners and bars! they can even include complete frame data, internal codepoints, and even their animations! 👏
- bars engine revamp, with invisible fills, advanced support for multi-char tips (which gradually enter and leave the bar), borders, tips and errors of any length, and underflow errors that can leap into the border if they can't fit!
- spinners engine revamp, with standardized factory signatures, improved performance, new types, and new features: smoother bouncing spinners (with an additional frame at the edges), optimized scrolling of text messages (which go slower and pause for a moment at the edges), new alongside and sequential spinners, nicer effect in alongside spinners (which use weighted spreading over the available space), smoother animation in scrolling spinners (when the input is longer than the available space)
- new builtin spinners, bars, and themes, which make use of the new animation features
- new showtime that displays themes and is dynamic => it does not scroll the screen when it can't fit vertically or horizontally, and can even filter for patterns!
- improved support for logging into files, which gets enriched as the print hook is!
- several new configuration options for customizing appearance, including support for disabling any `alive-progress` widgets!
- includes a new iterator adapter, `alive_it`, that accepts an iterable and calls `bar()` for you!
- requires Python 3.6+ (and officially supports Python 3.9 and 3.10)
> Since this is a major version change, direct backward compatibility is not guaranteed. If something does not work at first, just check the new imports and functions' signatures, and you should be good to go. All previous features should still work here! 👍
---
## Using `alive-progress`
### Get it
Just install with pip:
```sh
❯ pip install alive-progress
```
### Try it
If you're wondering what styles are builtin, it's `showtime`! ;)
```python
from alive_progress.styles import showtime
showtime()
```
> Note: Please disregard the path in the animated gif below, the correct one is above. These long gifs are very time-consuming to generate, so I can't make another on every single change. Thanks for your understanding.
I've made these styles just to try all the animation factories I've created, but I think some of them ended up very, very cool! Use them at will, and mix them to your heart's content!
Do you want to see actual `alive-progress` bars gloriously running in your system before trying them yourself?
```sh
❯ python -m alive_progress.tools.demo
```

### Awake it
Cool, huh?? Now enter an `ipython` REPL and try this:
```python
from alive_progress import alive_bar
import time
for x in 1000, 1500, 700, 0:
with alive_bar(x) as bar:
for i in range(1000):
time.sleep(.005)
bar()
```
You'll see something like this, with cool animations throughout the process 😜:
```
|████████████████████████████████████████| 1000/1000 [100%] in 5.8s (171.62/s)
|██████████████████████████▋⚠︎ | (!) 1000/1500 [67%] in 5.8s (172.62/s)
|████████████████████████████████████████✗︎ (!) 1000/700 [143%] in 5.8s (172.06/s)
|████████████████████████████████████████| 1000 in 5.8s (172.45/s)
```
Nice, huh? Loved it? I knew you would, thank you 😊.
To actually use it, just wrap your normal loop in an `alive_bar` context manager like this:
```python
with alive_bar(total) as bar: # declare your expected total
for item in items: # <<-- your original loop
print(item) # process each item
bar() # call `bar()` at the end
```
And it's alive! 👏
So, in a nutshell: retrieve the items as always, enter the `alive_bar` context manager with the number of items, and then iterate/process those items, calling `bar()` at the end! It's that simple! :)
### Master it
- The `items` argument can be any iterable, like for example, a queryset.
- The first argument of the `alive_bar` is the expected total, like `qs.count()` for querysets, `len(items)` for bounded iterables, or even some static number.
- Calling `bar()` is what makes the bar go forward — you usually call it once in every iteration, just after finishing an item.
- If you call `bar()` too much or too few, the bar will graphically render that deviation from the expected `total`, making it very easy to notice under and overflows.
- The usual Python `print()` is automatically hooked, so you can effortlessly display messages tightly integrated with the current progress bar on display! It won't break the fast bar refreshes in any way and will even enrich your message! The bar nicely cleans up the line, prints the current bar position alongside your message, and continues refreshing right below it!
- The standard Python `logging` framework is also automatically hooked and enriched, exactly like the `print()` above!
- If you're using the `click` CLI lib, you can even use `click.echo()` to print styled text.

> You can get creative! Since the bar goes forward only when you call `bar()`, it is **independent of the loop** it is in! So you can use it to monitor unrelated things like pending transactions, broken items, etc., or even call it more than once in the same iteration! That way, you'll get to know how many of these "special" events there were, including their percentage relative to the total!
Awesome right? And everything work the same both in real terminals and in Jupyter notebooks!
## The `bar` handler
After a bar has finished (or even while running), you have a plethora of methods available to grab information about the bar, and to control it. Here are they:
- `bar.text('message')` or `bar.text = 'message'`: set a situational message at the end of the bar, where you can display information about the current item or the phase the processing is in.
- `bar.title('Title')` or `bar.title = 'Title'`: set a title at the beginning of the bar; can be set right when starting it or while it's running or even after finished to affect the receipt on demand — mix it with `title_length` config to keep the bar from changing its length while running.
- `bar.current`: retrieve the current bar count or percentage — more details below on Modes of Operation.
- `bar.monitor` returns the current monitor widget text, which is the current bar position formatted according to the current configuration.
- `bar.eta`: returns the current ETA widget text, formatted according to the current configuration.
- `bar.rate`: returns the current throughput widget text, formatted according to the current configuration.
- `bar.elapsed`: returns the current elapsed time in seconds, with full precision.
- `bar.receipt`: returns an on-demand receipt, which can be used however you want in your code, such as logging or displaying it in a custom way.
- `bar.pause()`: pauses the bar without losing its state — more details below on the Pause Mechanism.
## Auto-iterating
You now have a quicker way to monitor anything! Here, the items are automatically tracked for you!
Behold the `alive_it` => the `alive_bar` iterator adapter!
Simply wrap your items with it, and loop over them as usual!
The bar will just work; it's that simple!
```python
from alive_progress import alive_it
for item in alive_it(items): # <<-- wrapped items
print(item) # process each item
```
HOW COOL IS THAT?! 😜
All `alive_bar` parameters apply but `total`, which is smarter (if not supplied, it will be auto-inferred from your data using `len` or `length_hint`), and `manual` that does not make sense here.
Note there isn't any `bar` handle at all in there. But what if you do want it, e.g. to set text messages or retrieve the current progress?
You can interact with the internal `alive_bar` by just assigning `alive_it` to a variable like this:
```python
bar = alive_it(items) # <<-- bar with wrapped items
for item in bar: # <<-- iterate on bar
print(item) # process each item
bar.text(f'ok: {item}') # WOW, it works!
```
Note that this is a slightly special `bar`, which does not support `bar()`, since the iterator adapter tracks items automatically for you. Also, it supports `finalize`, which enables you to set the title and/or text of the final receipt:
```python
alive_it(items, finalize=lambda bar: bar.text('Success!'))
...
```
> In a nutshell:
> - full use is always `with alive_bar() as bar`, where you iterate and call `bar()` whenever you want;
> - quick adapter use is `for item in alive_it(items)`, where items are automatically tracked;
> - full adapter use is `bar = alive_it(items)`, where in addition to items being automatically tracked, you get a special iterable `bar` able to customize the inner `alive_progress` however you want.
## Modes of operation
### Auto and Unknown: Counter
The default modes are **auto** and **unknown**, which use internally a **counter** to track the progress. They count the number of items processed, and use it to update the progress bar accordingly.
The `total` argument is optional. If you do provide it, the bar enters in **auto mode**. In this mode, the progress of the operation is automatically tracked, and all the widgets `alive-progress` has to offer are available: precise bar, spinner, percentage, counter, throughput, and ETA.
If you don't provide `total`, the bar enters in **unknown mode**. In this mode, the progress is indeterminable, and therefore the ETA, so the whole progress bar is continuously animated. The widgets available are: animated bar, spinner, counter, and throughput.
> The cool spinner runs completely independently of the animated bar, both running their own animations concurrently, rendering a unique show in your terminal! 😜
Last but not least, the **auto** mode has a unique ability: mark items as skipped, making the throughput and ETA much more accurate! More on that later.
### Manual: Percentage
The **manual mode**, manually activated by the `manual=True` argument, uses internally a **percentage** to track the progress. It enables you to get complete control of the bar position. It's usually used to monitor processes that only feed you a percentage of completion, or to generate some random special effects.
You can use it directly with `alive_bar` or via `config_handler`, and it allows you to send percentages to the `bar()` handler! For example, to set it to 15% completion, just call `bar(0.15)` — which is 15 / 100.
You can also provide `total` here. If you do, `alive-progress` will automatically infer an internal counter, and will thus be able to offer you all the same widgets available in auto mode!
If you don't provide `total`, you'll at least get rough versions of the throughput and ETA widgets, computed as "%/s" (percentage per second) and until 100%, respectively. Neither of them are very accurate, but they are better than nothing.
### Widgets available
When `total` is provided all is cool:
| mode | counter | percentage | throughput | ETA | over/underflow |
|:------:|:-------------:|:------------:|:----------:|:---:|:--------------:|
| auto | ✅ (user tick) | ✅ (inferred) | ✅ | ✅ | ✅ |
| manual | ✅ (inferred) | ✅ (user set) | ✅ | ✅ | ✅ |
When it isn't, some compromises have to be made:
| mode | counter | percentage | throughput | ETA | over/underflow |
|:-------:|:-------------:|:------------:|:------------:|:----------:|:--------------:|
| unknown | ✅ (user tick) | ❌ | ✅ | ❌ | ❌ |
| manual | ❌ | ✅ (user set) | ⚠️ (simpler) | ⚠️ (rough) | ✅ |
But it's actually simple to understand: you do not need to think about which mode you should use!
- Just always send the `total` if you have it, and use `manual` if you need it!
That's it! It will just work the best it can! 👏 \o/
### The different `bar()` handler semantics
The `bar()` handlers support either relative or absolute semantics, depending on the mode:
- _auto_ and _unknown_ modes use **optional relative** positioning, so you can just call `bar()` to increment the counter by one, or send any other increment like `bar(200)` to increment by 200 at once;
> they even support `bar(0)` and `bar(-5)` to hold or decrement if needed!
- _manual_ mode uses **mandatory absolute** positioning, so you can call `bar(0.35)` to make the bar instantly jump to 35% progress.
> Both modes enable you to get creative! Since you can just make the bar go instantly to whatever position you want, you can:
> - make it go backwards — e.g. to graphically display the timeout of something;
> - create special effects — e.g. to mimic a real-time analog gauge of some sort.
You can call `bar()` as many times as you want! The terminal refresh rate will always be asynchronously computed according to the current throughput and progress, so you won't risk spamming the terminal with more updates than needed.
In any case, to retrieve the current counter/percentage, just call: `bar.current`:
- in _auto_ and _unknown_ modes, this provides an **integer** — the actual internal counter;
- in _manual_ mode, this provides a **float** in the interval [0, 1] — the last percentage set.
Finally, the `bar()` handler in **auto** mode leverages a unique ability: skip items! Just call `bar(skipped=True)` or `bar(10, skipped=True)` to exclude those items from the throughput calculations, and thus preventing them from inaccurately affecting the ETA.
---
Maintaining an open source project is hard and time-consuming, and I've put much ❤️ and effort into this.
If you've appreciated my work, you can back me up with a donation! Thank you 😊
[](https://www.buymeacoffee.com/rsalmei)
[](https://www.paypal.com/donate?business=6SWSHEB5ZNS5N&no_recurring=0&item_name=I%27m+the+author+of+alive-progress%2C+clearly+and+about-time.+Thank+you+for+appreciating+my+work%21¤cy_code=USD)
---
## Styles
The `showtime` exhibit has an optional argument to choose which show to present, `Show.SPINNERS` (default), `Show.BARS` or `Show.THEMES`, do take a look at them! ;)
```python
from alive_progress.styles import showtime, Show
showtime(Show.BARS)
showtime(Show.THEMES)
```
> Note: Please disregard the path in the animated gif below, the correct one is above. These long gifs are very time-consuming to generate, so I can't make another on every single change. Thanks for your understanding.
And the themes one (📌 new in 2.0):
The `showtime` exhibit also accepts some customization options:
- **fps**: the frames per second rate refresh rate, default is 15;
- **length**: the length of the bars, default is 40;
- **pattern**: a filter to choose which ones to display.
For example to get a marine show, you can `showtime(pattern='boat|fish|crab')`:

> You can also access these shows with the shorthands `show_bars()`, `show_spinners()`, and `show_themes()`!
> There's also a small utility called `print_chars()`, to help find that cool character to put in your customized spinners and bars, or to determine if your terminal does support Unicode characters.
## Configuration
There are several options to customize both appearance and behavior!
All of them can be set both directly in the `alive_bar` or globally in the `config_handler`!
These are the options - default values in brackets:
- `title`: an optional, always visible bar title
- `length`: [`40`] the number of cols to render the animated progress bar
- `max_cols`: [`80`] the maximum cols to use if not possible to fetch it, like in jupyter
- `spinner`: the spinner style to be rendered next to the bar
↳ accepts a predefined spinner name, a custom spinner factory, or None
- `bar`: the bar style to be rendered in known modes
↳ accepts a predefined bar name, a custom bar factory, or None
- `unknown`: the bar style to be rendered in the unknown mode
↳ accepts a predefined spinner name, or a custom spinner factory (cannot be None)
- `theme`: [`'smooth'`] a set of matching spinner, bar, and unknown
↳ accepts a predefined theme name
- `force_tty`: [`None`] forces animations to be on, off, or according to the tty (more details [here](#forcing-animations-on-pycharm-jupyter-etc))
↳ None -> auto select, according to the terminal/Jupyter
↳ True -> unconditionally enables animations, but still auto-detects Jupyter Notebooks
↳ False -> unconditionally disables animations, keeping only the final receipt
- `file`: [`sys.stdout`] the file object to use: `sys.stdout`, `sys.stderr`, or a similar `TextIOWrapper`
- `disable`: [`False`] if True, completely disables all output, do not install hooks
- `manual`: [`False`] set to manually control the bar position
- `enrich_print`: [`True`] enriches print() and logging messages with the bar position
- `enrich_offset`: [`0`] the offset to apply to enrich_print
- `receipt`: [`True`] prints the nice final receipt, disables if False
- `receipt_text`: [`False`] set to repeat the last text message in the final receipt
- `monitor` (bool|str): [`True`] configures the monitor widget `152/200 [76%]`
↳ send a string with `{count}`, `{total}` and `{percent}` to customize it
- `elapsed` (bool|str): [`True`] configures the elapsed time widget `in 12s`
↳ send a string with `{elapsed}` to customize it
- `stats` (bool|str): [`True`] configures the stats widget `(123.4/s, eta: 12s)`
↳ send a string with `{rate}` and `{eta}` to customize it
- `monitor_end` (bool|str): [`True`] configures the monitor widget within final receipt
↳ same as monitor, the default format is dynamic, it inherits `monitor`'s one
- `elapsed_end` (bool|str): [`True`] configures the elapsed time widget within final receipt
↳ same as elapsed, the default format is dynamic, it inherits `elapsed`'s one
- `stats_end` (bool|str): [`True`] configures the stats widget within final receipt
↳ send a string with `{rate}` to customize it (no relation to stats)
- `title_length`: [`0`] fixes the length of titles, or 0 for unlimited
↳ title will be truncated if longer, and a cool ellipsis "…" will appear at the end
- `spinner_length`: [`0`] forces the spinner length, or `0` for its natural one
- `refresh_secs`: [`0`] forces the refresh period to this, `0` is the reactive visual feedback
- `ctrl_c`: [`True`] if False, disables CTRL+C (captures it)
- `dual_line`: [`False`] if True, places the text below the bar
- `unit`: any text that labels your entities
- `scale`: the scaling to apply to units: `None`, `SI`, `IEC`, or `SI2`
↳ supports aliases: `False` or `''` -> `None`, `True` -> `SI`, `10` or `'10'` -> `SI`, `2` or `'2'` -> `IEC`
- `precision`: [`1`] how many decimals do display when scaling
And there's also one that can only be set locally in the `alive_bar` context:
- `calibrate`: maximum theoretical throughput to calibrate the animation speed (more details [here](#fps-calibration))
To set them locally, just send them as keyword arguments to `alive_bar`:
```python
with alive_bar(total, title='Processing', length=20, bar='halloween') as bar:
...
```
To use them globally, send them to `config_handler`, and any `alive_bar` created after that will include those options! And you can mix and match them, local options always have precedence over global ones:
```python
from alive_progress import config_handler
config_handler.set_global(length=20, spinner='wait')
with alive_bar(total, bar='blocks', spinner='twirls') as bar:
# the length is 20, the bar is 'blocks' and the spinner is 'twirls'.
...
```
## Create your own animations
Yes, you can assemble your own spinners! And it's easy!
I've created a plethora of special effects, so you can just mix and match them any way you want! There are frames, scrolling, bouncing, sequential, alongside, and delayed spinners! Get creative! 😍
### Intro: How do they work?
The spinners' animations are engineered by very advanced generator expressions, deep within several layers of meta factories, factories and generators 🤯!
- the meta factory (public interface) receives the styling parameters from you, the user, and processes/stores them inside a closure to create the actual factory => this is the object you'll send to both `alive_bar` and `config_handler`;
- internally it still receives other operating parameters (like for instance the rendition length), to assemble the actual generator expression of the animation cycles of some effect, within yet another closure;
- this, for each cycle, assembles another generator expression for the animation frames of the same effect;
- these generators together finally produce the streams of cycles and frames of the cool animations we see on the screen! Wow! 😜👏
These generators are capable of multiple different animation cycles according to the spinner behavior, e.g. a bouncing spinner can run one cycle to smoothly bring a subject into the scene, then repeatedly reposition it until the other side, then make it smoothly disappear off the scene => and this is all only one cycle! Then it can be followed by another cycle to make it all again but backwards!
And bouncing spinners also accept _different_ and _alternating_ patterns in both the right and left directions, which makes them generate the cartesian product of all the combinations, possibly producing dozens of different cycles until they start repeating them!! 🤯
And there's more, I think one of the most impressive achievements I got in this animation system (besides the spinner compiler itself)... They only yield more animation frames until the current cycle is not exhausted, then **they halt themselves**! Yep, the next cycle does not start just yet! This behavior creates natural breaks in exactly the correct spots, where the animations are not disrupted, so I can smoothly link with whatever other animation I want!!
This has all kinds of cool implications: the cycles can have different frame counts, different screen lengths, they do not need to be synchronized, they can create long different sequences by themselves, they can cooperate to play cycles in sequence or alongside, and I can amaze you displaying several totally distinct animations at the same time without any interferences whatsoever!
> It's almost like they were... _alive_!! 😄
>
==> Yes, that's where this project's name came from! 😉
### A Spinner Compiler, really?
Now, these generators of cycles and frames are fully consumed ahead of time by the **Spinner Compiler**! This is a very cool new processor that I made inside the _Cell Architecture_ effort, to make all these animations work even in the presence of wide chars or complex grapheme clusters! It was very hard to make these clusters gradually enter and exit frames, smoothly, while keeping them from breaking the Unicode encoding and especially maintain their original lengths in all frames! Yes, several chars in sequence can represent another completely different symbol, so they cannot ever be split! They have to enter and exit the frame always together, all at once, or the grapheme won't show up at all (an Emoji for instance)!! Enter the **Spinner Compiler**......
This has made possible some incredible things!! Since this Compiler generates the whole spinner frame data beforehand:
- the grapheme fixes can be applied only once;
- the animations do not need to be calculated again!
> So, I can just collect all that _ready to play_ animations and be done with it, **no runtime overhead** at all!! 👏
Also, with the complete frame data compiled and persisted, I could create several commands to **refactor** that data, like changing shapes, replacing chars, adding visual pauses (frame repetitions), generating bouncing effects on-demand over any content, and even transposing cycles with frames!!
But how can you see these effects? Does the effect you created look good? Or is it not working as you thought? YES, now you can see all generated cycles and frames analytically, in a very beautiful rendition!!
I love what I've achieved here 😊, it's probably THE most beautiful tool I've ever created... Behold the `check` tool!!

It's awesome if I say so myself, isn't it? And a very complex piece of software I'm proud of, [take a look at its code](alive_progress/animations/spinner_compiler.py) if you'd like.
And the `check` tool is much more powerful! For instance, you can see the codepoints of the frames!!! And maybe have a glimpse of why this version was so, so very hard and complex to make...
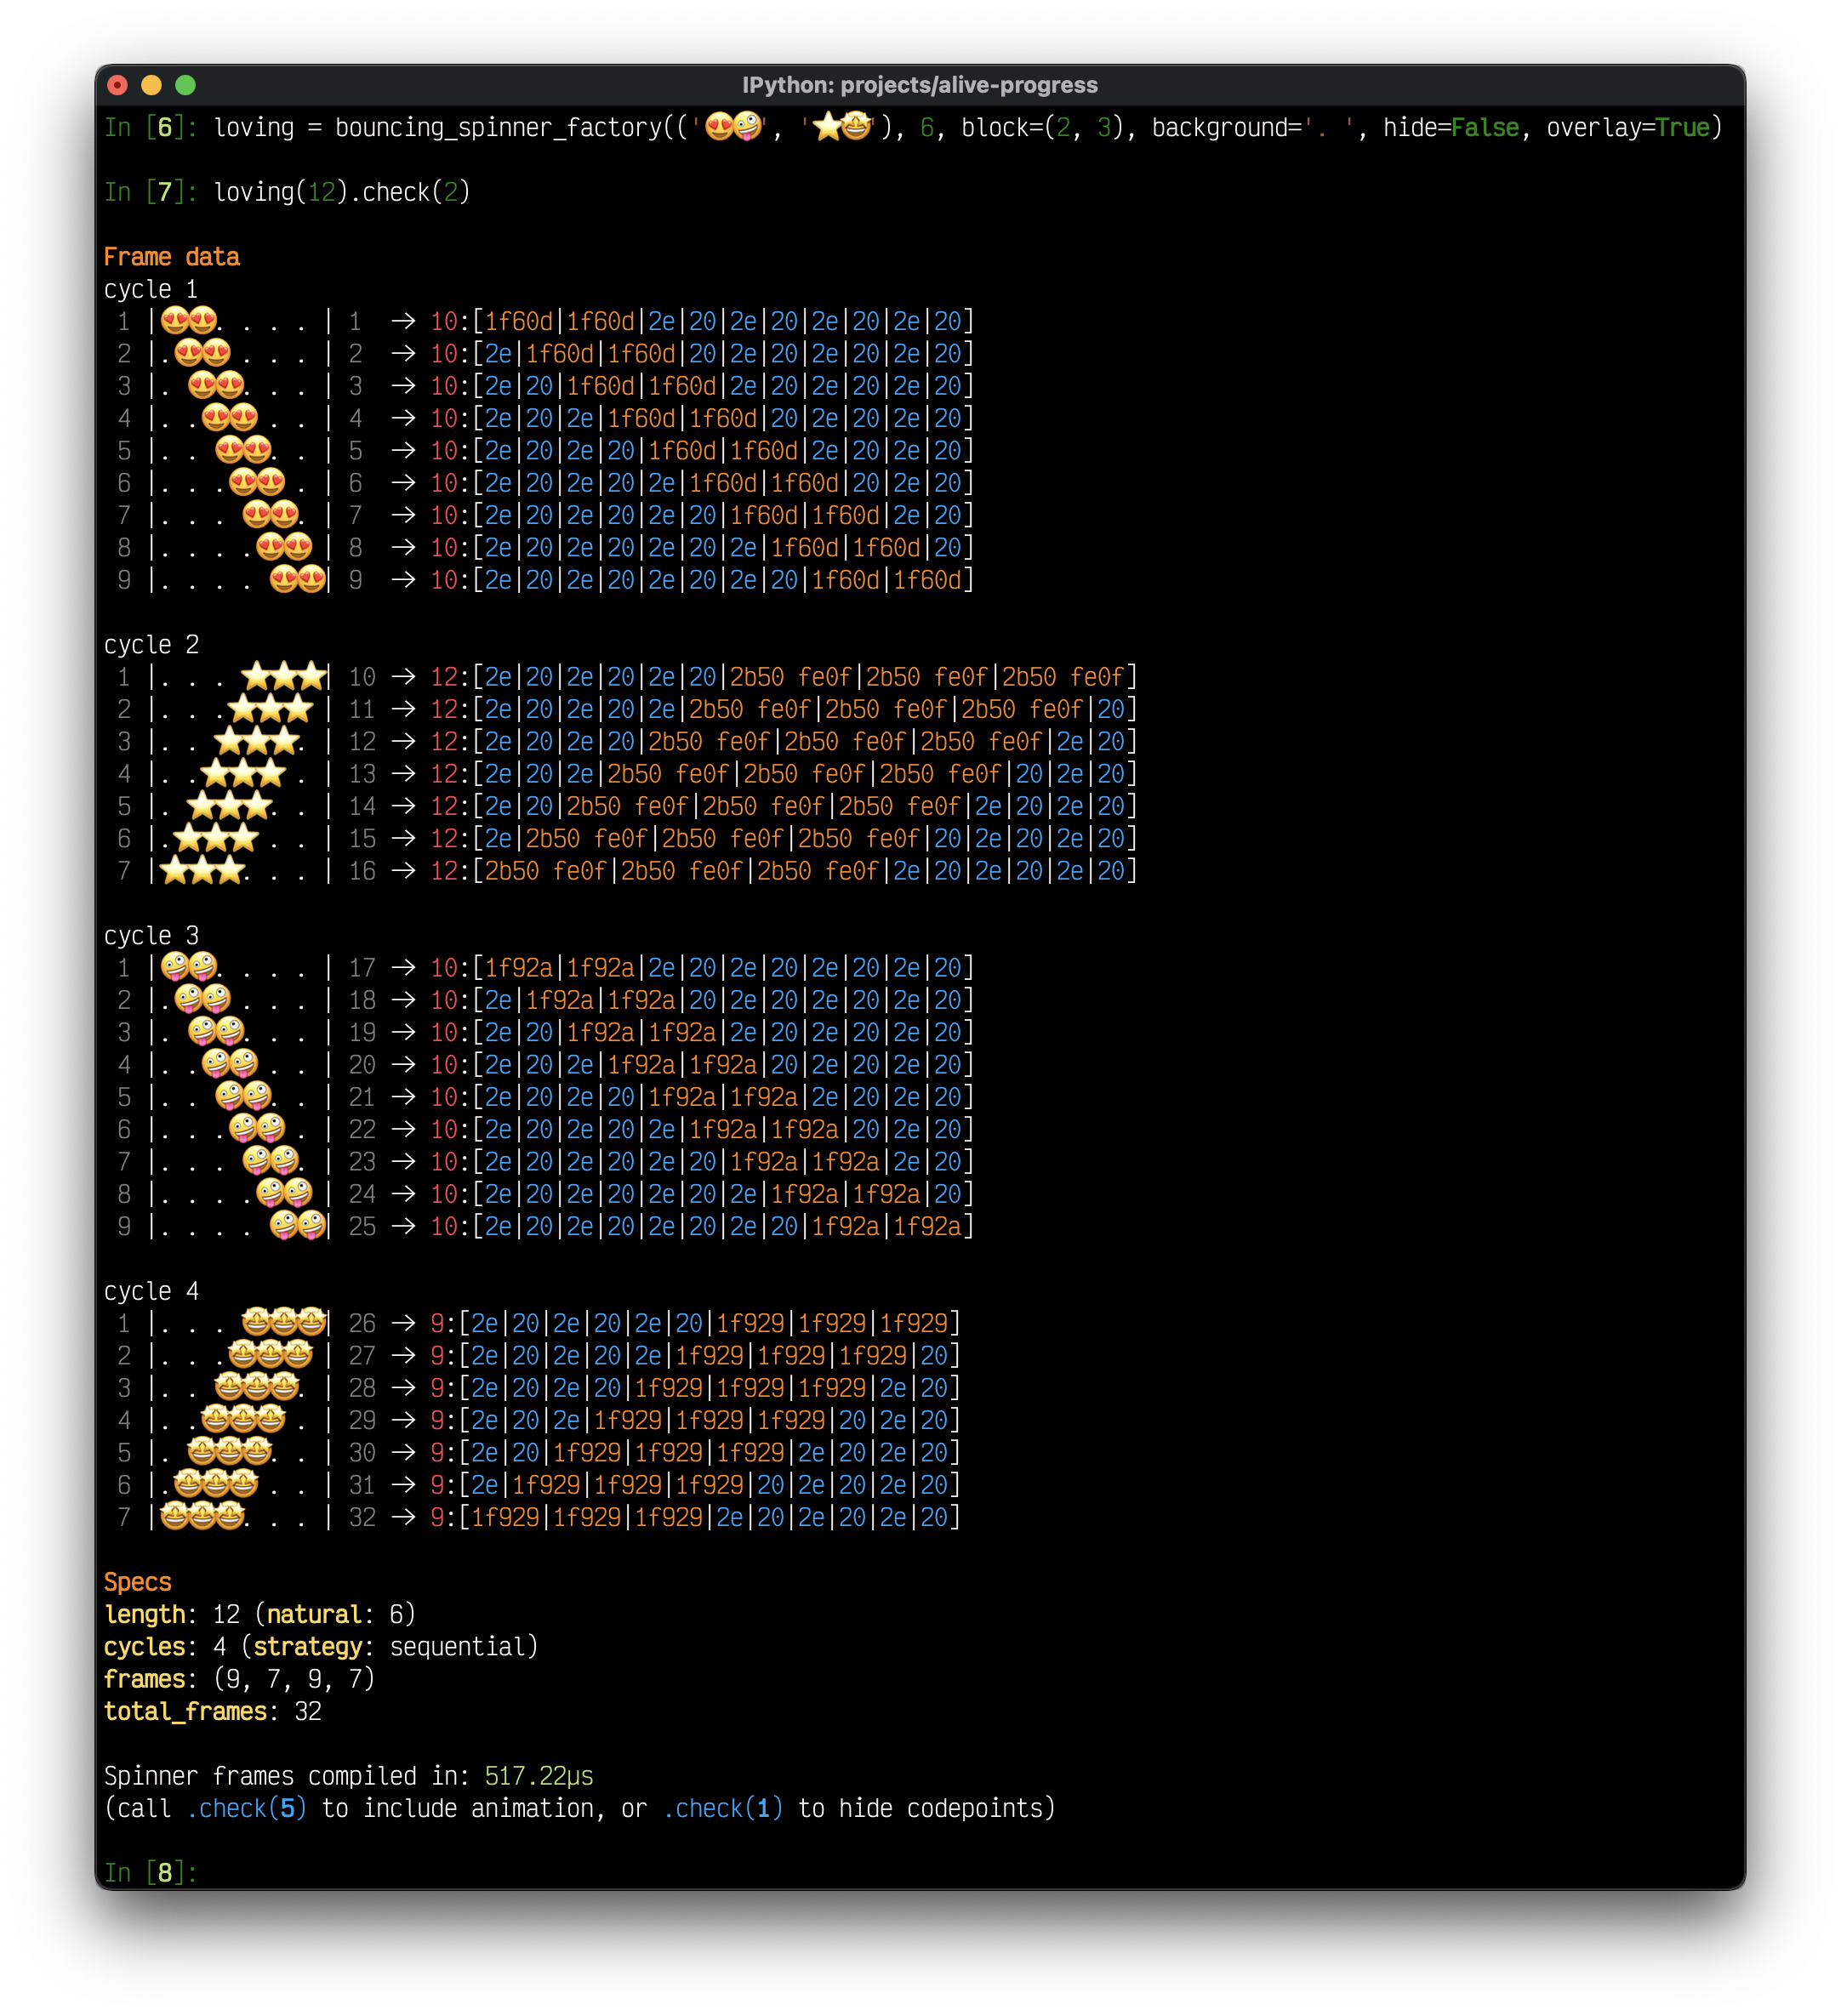
In red, you see the grapheme clusters, that occupy one or two "logical positions", regardless of their actual sizes... These are the "Cells" of the new _Cell Architecture_...
Look how awesome an Emoji Flag is represented:

The flag seems to move so smoothly because it uses "half-characters"! Since it is a wide char, `alive-progress` knows it will be rendered with "two visible chars", and the animations consider this, but compose with spaces, which occupy only one. When one uses mixed backgrounds, the situation is much more complex...
### Spinner Factories
The types of factories I've created are:
- `frames`: draws any sequence of characters at will, that will be played frame by frame in sequence;
- `scrolling`: generates a smooth flow from one side to the other, hiding behind or wrapping upon invisible borders — allows using subjects one at a time, generating several cycles of distinct characters;
- `bouncing`: similar to `scrolling`, but makes the animations bounce back to the start, hiding behind or immediately bouncing upon invisible borders;
- `sequential` get a handful of factories and play them one after the other sequentially! allows to intermix them or not;
- `alongside` get a handful of factories and play them alongside simultaneously, why choose when you can have them all?! allows to choose the pivot of the animation;
- `delayed`: get any other factory and copy it multiple times, increasingly skipping some frames on each one! very cool effects are made here!
For more details please look at their docstrings, which are very complete.
### Bar Factories
Customizing bars is nowhere near that involved. Let's say they are "immediate", passive objects. They do not support animations, i.e. they will always generate the same rendition given the same parameters. Remember spinners are infinite generators, capable of generating long and complex sequences.
Well, bars also have a meta factory, use closures to store the styling parameters, and receive additional operating parameters, but then the actual factory can't generate any content by itself. It still needs an extra parameter, a floating-point number between 0 and 1, which is the percentage to render itself.
> `alive_bar` calculates this percentage automatically based on the counter and total, but you can send it yourself when in the `manual` mode!
Bars also do not have a Bar Compiler, but they **do provide the check tool**!! 🎉

You can even mix and match wide chars and normal chars just like in spinners! (and everything keeps perfectly aligned 😅)

> Use the check tools to your heart's content!! They have even more goodies awaiting you, even real-time animations!
> Create the wildest and coolest animations you can and send them to me!
>
I'm thinking about creating some kind of `contrib` package, with user-contributed spinners and bars!
Wow, if you've read everything till here, you should now have a sound knowledge about using `alive-progress`! 👏
But brace yourself because there is even more, exciting stuff lies ahead!
---
Maintaining an open source project is hard and time-consuming, and I've put much ❤️ and effort into this.
If you've appreciated my work, you can back me up with a donation! Thank you 😊
[](https://www.buymeacoffee.com/rsalmei)
[](https://www.paypal.com/donate?business=6SWSHEB5ZNS5N&no_recurring=0&item_name=I%27m+the+author+of+alive-progress%2C+clearly+and+about-time.+Thank+you+for+appreciating+my+work%21¤cy_code=USD)
---
## Advanced
### The Pause Mechanism
Oh, you want to pause it altogether, I hear? This is an amazing novel concept, not found anywhere AFAIK.
With this you get to act on some items **manually**, at will, right in the middle of an ongoing processing!!
YES, you can return to the prompt and fix, change, submit things, and the bar will just "remember" where it was...
Suppose you need to reconcile payment transactions (been there, done that). You need to iterate over thousands of them, detect somehow the faulty ones, and fix them. This fix is not simple nor deterministic, you need to study each one to understand what to do. They could be missing a recipient, or have the wrong amount, or not be synced with the server, etc., it's hard to even imagine all possibilities.
Typically, you would have to let the detection process run until completion, appending to a list each inconsistency it finds and waiting, potentially a long time, until you can finally start fixing them... You could of course mitigate that by processing in chunks, or printing them and acting via another shell, etc., but those have their own shortcomings... 😓
Now, there's a better way! Simply pause the actual detection process for a while! Then you just have to wait till the next fault is found, and act in near real-time!
To use the pause mechanism you just have to write a function, so the code can `yield` the items you want to interact with. You most probably already use one in your code, but in the `ipython` shell or another REPL you probably don't. So just wrap your debug code in a function, then enter within a `bar.pause()` context!!
```python
def reconcile_transactions():
qs = Transaction.objects.filter() # django example, or in sqlalchemy: session.query(Transaction).filter()
with alive_bar(qs.count()) as bar:
for transaction in qs:
if faulty(transaction):
with bar.pause():
yield transaction
bar()
```
That's it! It's that simple! \o/
Now run `gen = reconcile_transactions()` to instantiate the generator, and whenever you want the next faulty transaction, just call `next(gen, None)`! I love it...
The `alive-progress` bar will start and run as usual, but as soon as any inconsistency is found, the bar will pause itself, turning off the refresh thread and remembering its exact state, and yield the transaction to you directly on the prompt! It's almost magic! 😃
```text
In [11]: gen = reconcile_transactions()
In [12]: next(gen, None)
|█████████████████████ | 105/200 [52%] in 5s (18.8/s, eta: 4s)
Out[12]: Transaction<#123>
```
You can then inspect the transaction with the usual `_` shortcut of `ipython` (or just directly assign it with `t = next(gen, None)`), and you're all set to fix it!
When you're done, just reactivate the bar with the same `next` call as before!! The bar reappears, turns everything back on, and continues **like it had never stopped**!! Ok, it is magic 😜
```text
In [21]: next(gen, None)
|█████████████████████ | ▁▃▅ 106/200 [52%] in 5s (18.8/s, eta: 4s)
```
Rinse and repeat till the final receipt appears, and there'll be no faulty transactions anymore. 😄
### Loop-less use
So, you need to monitor a fixed operation, without any loops, right?
It'll work for sure! Here is a naive example (we'll do better in a moment):
```python
with alive_bar(4) as bar:
corpus = read_file(file)
bar() # file was read, tokenizing
tokens = tokenize(corpus)
bar() # tokens generated, processing
data = process(tokens)
bar() # process finished, sending response
resp = send(data)
bar() # we're done! four bar calls with `total=4`
```
It's naive because it assumes all steps take the same amount of time, but actually, each one may take a very different time to complete. Think `read_file` and `tokenize` may be extremely fast, which makes the percentage skyrocket to 50%, then stopping for a long time in the `process` step... You get the point, it can ruin the user experience and create a very misleading ETA.
To improve upon that you need to distribute the steps' percentages accordingly! Since you told `alive_bar` there were four steps, when the first one was completed it understood 1/4 or 25% of the whole processing was complete... Thus, you need to measure how long your steps actually take and use the **manual mode** to increase the bar percentage by the right amount at each step!
You can use my other open source project [about-time](https://github.com/rsalmei/about-time) to easily measure these durations! Just try to simulate with some representative inputs, to get better results. Something like:
```python
from about_time import about_time
with about_time() as t_total: # this about_time will measure the whole time of the block.
with about_time() as t1: # the other four will get the relative timings within the whole.
corpus = read_file(file) # `about_time` supports several calling conventions, including one-liners.
with about_time() as t2: # see its documentation for more details.
tokens = tokenize(corpus)
with about_time() as t3:
data = process(tokens)
with about_time() as t4:
resp = send(data)
print(f'percentage1 = {t1.duration / t_total.duration}')
print(f'percentage2 = {t2.duration / t_total.duration}')
print(f'percentage3 = {t3.duration / t_total.duration}')
print(f'percentage4 = {t4.duration / t_total.duration}')
```
There you go! Now you know the relative timings of all the steps, and can use them to improve your original code! Just get the cumulative timings and put them within a manual mode `alive_bar`!
For example, if the timings you found were 10%, 30%, 20%, and 40%, you'd use 0.1, 0.4, 0.6, and 1.0 (the last one should always be 1.0):
```python
with alive_bar(4, manual=True) as bar:
corpus = read_big_file()
bar(0.1) # 10%
tokens = tokenize(corpus)
bar(0.4) # 30% + 10% from previous steps
data = process(tokens)
bar(0.6) # 20% + 40% from previous steps
resp = send(data)
bar(1.) # always 1. in the last step
```
That's it! The user experience and ETA should be greatly improved now.
### FPS Calibration
Yes, you can calibrate the spinner speed!
The `alive-progress` bars have cool visual feedback of the current throughput, so you can actually **see** how fast your processing is, as the spinner runs faster or slower with it.
For this to happen, I've put together and implemented a few fps curves to empirically find which one gave the best feel of speed:

(interactive version [here](https://www.desmos.com/calculator/ema05elsux))
The graph shows the logarithmic (red), parabolic (blue) and linear (green) curves, these are the ones I started with. It was not an easy task, I've made dozens of tests, and never found one that really inspired that feel of speed I was looking for. The best one seemed to be the logarithmic one, but it reacted poorly with small numbers.
I know I could make it work with a few twists for those small numbers, so I experimented a lot and adjusted the logarithmic curve (dotted orange) until I finally found the behavior I expected! It is the one that seemed to provide the best all-around perceived speed changes throughout the whole spectrum from a few to billions...
That is the curve I've settled with, and it's the one used in all modes and conditions. In the future and if someone would find it useful, that curve could be configurable.
Well, the default `alive-progress` calibration is **1,000,000** in bounded modes, i.e., it takes 1 million iterations per second for the bar to refresh itself at 60 frames per second. In the manual unbounded mode, it is **1.0** (100%). Both enable a vast operating range and generally work quite well.
For example, take a look at the effect these very different calibrations have, running the very same code at the very same speed! Notice the feel the spinner passes to the user, is this processing going slow or going fast? And remember that isn't only the spinner refreshing but the whole line, complete with the bar rendition and all widgets, so everything gets smoother or sluggish:

> So, if your processing hardly gets to 20 items per second, and you think `alive-progress` is rendering sluggish, you could increase that sense of speed by calibrating it to let's say `40`, and it will be running waaaay faster... It is better to always leave some headroom and calibrate it to something between 50% and 100% more, and then tweak it from there to find the one you like the most! :)
### Forcing animations on PyCharm, Jupyter, etc.
Do these astonishing `alive-progress` animations refuse to display?
PyCharm is awesome, I love it! But I'll never understand why they've disabled emulating a terminal by default... If you do use PyCharm's output console, please enable this on all your Run Configurations:

> I even recommend you go into `File` > `New Projects Setup` > `Run Configuration Templates`, select `Python`, and also enable it there, so any new ones you create will already have this set.
In addition to that, some terminals report themselves as "non-interactive", like when running out of a real terminal (PyCharm and Jupyter for example), in shell pipelines (`cat file.txt | python program.py`), or in background processes (not connected to a tty).
When `alive-progress` finds itself in a non-interactive terminal, it automatically disables all kinds of animations, printing only the final receipt. This is made in order to avoid both messing up the pipeline output and spamming your log file with thousands of `alive-progress` refreshes.
So, when you know it's safe, you can force them to see `alive-progress` in all its glory! Here is the `force_tty` argument:
```python
with alive_bar(1000, force_tty=True) as bar:
for i in range(1000):
time.sleep(.01)
bar()
```
The values accepted are:
- `force_tty=True` -> always enables animations, and auto-detects Jupyter Notebooks!
- `force_tty=False` -> always disables animations, keeping only the final receipt
- `force_tty=None` (default) -> auto detect, according to the terminal's tty state
You can also set it system-wide using `config_handler`, so you don't need to pass it manually anymore.
> Do note that PyCharm's console and Jupyter notebooks are heavily instrumented and thus have much more overhead, so the outcome may not be as fluid as you would expect. On top of that, Jupyter notebooks do not support ANSI Escape Codes, so I had to develop some workarounds to emulate functions like "clear the line" and "clear from cursor"... To see the fluid and smooth `alive_bar` animations as I intended, always prefer a full-fledged terminal.
## Interesting facts
- This whole project was implemented in functional style;
- It uses extensively (and very creatively) Python _Closures_ and _Generators_, e.g. all [spinners](https://github.com/rsalmei/alive-progress/blob/main/alive_progress/animations/spinners.py#L10) are made with cool _Generator Expressions_! Besides it, there are other cool examples like the [exhibit](https://github.com/rsalmei/alive-progress/blob/main/alive_progress/styles/exhibit.py#L42) module, and the core [spinner player](https://github.com/rsalmei/alive-progress/blob/main/alive_progress/animations/utils.py#L10-L17)/[spinner runner](https://github.com/rsalmei/alive-progress/blob/main/alive_progress/animations/spinner_compiler.py#L233) generators; 😜
- Until 2.0, `alive-progress` hadn't had any dependency. Now it has two: one is [about-time](https://github.com/rsalmei/about-time) (another interesting project of mine, if I say so myself), which is used to track the time it takes for the spinner compilation, and to generate its human-friendly renditions. The other is [grapheme](https://github.com/alvinlindstam/grapheme), to detect grapheme cluster breaks (I've opened an [issue](https://github.com/alvinlindstam/grapheme/issues/13) there asking about the future and correctness of it, and the author guarantees he intends to update the project on every new Unicode version);
- Also, until 2.0, `alive-progress` hadn't had a single Python class! Now it has a few tiny ones for very specific reasons (change callables, iterator adapters, and some descriptors for the `alive_bar` widgets).
- Everything else is either a function or a closure, which generate other closures internally with some state on the parent context. I've used them to create spinner factories, bar factories, the global configuration, the system hooks, the spinner compiler (which is also a big _Function Decorator_), etc.! Even `alive_bar` itself is just a function! Although, to be fair, it is "just" a function where I dynamically plug several closures from within into itself (remember that Python functions have a `__dict__` just like classes do 😝).
## To do
- enable multiple simultaneous bars for nested or multiple activities (the most requested feature, but very complex).
- reset a running bar context, i.e. run in unknown mode while "quantifying" the work, then switch to the auto mode.
- dynamic bar width rendition, which notices terminal size changes and shrink or expand the bar as needed (currently `alive_bar` does notice terminal size changes, but just truncates the line accordingly).
- improve test coverage, currently at 87% branch coverage (but it's very hard since it's multithreaded, full of stateful closures, and includes system print hooks).
- create a `contrib` system somehow, to allow a simple way to share cool spinners and bars from users.
- support colors in spinners and bars (it's very hard, since color codes alter string sizes, which makes it tricky to synchronize animations and correctly slicing, reversing, and iterating fragments of strings while _still keeping color codes_--which is very, very complex) --> probably simpler now with the new _Cell Architecture_.
- any other ideas are welcome!
Noteworthy features already done ✅
- resuming computations support with `skipped` items
- help system on configuration errors
- readable widgets to extract information
- exponential smoothing algorithm for the rate
- support for using `stderr` and other files instead of `stdout`
- units with automatic scaling
- dual-line mode
- customize final receipt widgets
- customize widgets rendition like `monitor`, `elapsed`, `stats`
- bar title can be dynamically set, changed or removed
- exponential smoothing algorithm for the ETA
- jupyter notebook support, which works the same as in the terminal, animations and everything
- create an unknown mode for bars (without a known total and eta)
- implement a pausing mechanism
- change spinner styles
- change bar styles
- include a global configuration system
- create customizable generators for scrolling, bouncing, delayed, and compound spinners
- create an exhibition for spinners and bars, to see them all in motion
- include theme support in configuration
- soft wrapping support
- hiding cursor support
- Python logging support
- exponential smoothing of ETA time series
- create an exhibition for themes
Changelog highlights
Complete [here](https://github.com/rsalmei/alive-progress/blob/main/CHANGELOG.md).
- 3.3.0: new bar.receipt and bar.elapsed; allow changing bar title and text even after finished; use `graphemeu` dependency; add `py.typed`; include Python 3.14 support in CI
- 3.2.0: print/logging hooks now support multithreading, rounded ETAs for long tasks, support for zero and negative bar increments, custom offset for enriched print/logging messages, improved compatibility with PyInstaller and Celery, drop 3.7 and 3.8, hello 3.12 and 3.13
- 3.1.4: support spaces at the start and end of titles and units
- 3.1.3: better error handling of invalid `alive_it` calls, detect nested uses of alive_progress and throw a clearer error message
- 3.1.2: fix some exotic ANSI Escape Codes not being printed (OSC)
- 3.1.1: support for printing ANSI Escape Codes without extra newlines, typing annotations in `alive_it`
- 3.1.0: new resuming computations support with `skipped` items, new `max_cols` config setting for jupyter, fix fetching the size of the terminal when using stderr, officially supports Python 3.11
- 3.0.1: fix for logging streams that extend StreamHandler but doesn't allow changing streams
- 3.0.0: units support with automatic and configurable scaling and precision, automatic stats scaling for slow throughputs, support for using `sys.stderr` and other files instead of `sys.stdout`, smoothed out the rate estimation, more queries into the currently running widgets' data, help system in configuration errors
- 2.4.1: fix a crash when dual-line and disabled are set
- 2.4.0: support dual line text mode; finalize function parameter in alive_it; improve logging support, detecting customized ones
- 2.3.1: introduce ctrl_c config param; print the final receipt even when interrupted
- 2.3.0: customizable `monitor`, `elapsed`, and `stats` core widgets, new `monitor_end`, `elapsed_end`, and `stats_end` core widgets, better support for CTRL+C, which makes `alive_bar` stop prematurely
- 2.2.0: bar title can be dynamically set, changed or removed; customizable refresh rates; final receipt can be hidden; `click.echo()` support; faster performance; safer detection of terminal columns; `bar.current` acts like a property; remove Python 3.6
- 2.1.0: Jupyter notebook support (experimental), Jupyter auto-detection, disable feature and configuration
- 2.0.0: new system-wide Cell Architecture with grapheme clusters support; super cool spinner compiler and runner; `.check()` tools in both spinners and bars; bars and spinners engines revamp; new animation modes in alongside and sequential spinners; new builtin spinners, bars, and themes; dynamic showtime with themes, scroll protection and filter patterns; improved logging for files; several new configuration options for customizing appearance; new iterator adapter `alive_it`; uses `time.perf_counter()` high-resolution clock; requires Python 3.6+ (and officially supports Python 3.9 and 3.10)
- 1.6.2: new `bar.current()` method; newlines get printed on vanilla Python REPL; the bar is truncated to 80 chars on Windows
- 1.6.1: fix logging support for Python 3.6 and lower; support logging for file; support for wide Unicode chars, which use 2 columns but have length 1
- 1.6.0: soft wrapping support; hiding cursor support; Python logging support; exponential smoothing of ETA time series; proper bar title, always visible; enhanced times representation; new `bar.text()` method, to set situational messages at any time, without incrementing position (deprecates 'text' parameter in `bar()`); performance optimizations
- 1.5.1: fix compatibility with Python 2.7 (should be the last one, version 2 is in the works, with Python 3 support only)
- 1.5.0: standard_bar accepts a `background` parameter instead of `blank`, which accepts arbitrarily sized strings and remains fixed in the background, simulating a bar going "over it"
- 1.4.4: restructure internal packages; 100% branch coverage of all animations systems, i.e., bars and spinners
- 1.4.3: protect configuration system against other errors (length='a' for example); first automated tests, 100% branch coverage of configuration system
- 1.4.2: sanitize text input, keeping \n from entering and replicating bar on the screen
- 1.4.1: include license file in the source distribution
- 1.4.0: print() enrichment can now be disabled (locally and globally), exhibits now have a real-time fps indicator, new exhibit functions `show_spinners` and `show_bars`, new utility `print_chars`, `show_bars` gain some advanced demonstrations (try it again!)
- 1.3.3: further improve stream compatibility with isatty
- 1.3.2: beautifully finalize bar in case of unexpected errors
- 1.3.1: fix a subtle race condition that could leave artifacts if ended very fast, flush print buffer when position changes or bar terminates, keep the total argument from unexpected types
- 1.3.0: new fps calibration system, support force_tty and manual options in global configuration, multiple increment support in bar handler
- 1.2.0: filled blanks bar styles, clean underflow representation of filled blanks
- 1.1.1: optional percentage in manual mode
- 1.1.0: new manual mode
- 1.0.1: pycharm console support with force_tty, improve compatibility with Python stdio streams
- 1.0.0: first public release, already very complete and mature
## Python End of Life notice
`alive_progress` will always try to keep up with Python, so starting from version 2.0, I'll drop support for all Python versions which enter EoL. See their schedule [here](https://endoflife.date/python).
But don't worry if you can't migrate just yet: `alive_progress` versions are perennial, so just keep using the one that works for you and you're good.
I just strongly recommend setting older `alive_progress` packages in a requirements.txt file with the following formats. These will always fetch the latest build releases previous to a given version, so, if I ever release bug fixes, you'll get them too.
### For Python 2.7 and 3.5
```sh
❯ pip install -U "alive_progress<2"
```
### For Python 3.6
```sh
❯ pip install -U "alive_progress<2.2"
```
### For Python 3.7 and 3.8
```sh
❯ pip install -U "alive_progress<3.2"
```
## License
This software is licensed under the MIT License. See the LICENSE file in the top distribution directory for the full license text.
---
Maintaining an open source project is hard and time-consuming, and I've put much ❤️ and effort into this.
If you've appreciated my work, you can back me up with a donation! Thank you 😊
[](https://www.buymeacoffee.com/rsalmei)
[](https://www.paypal.com/donate?business=6SWSHEB5ZNS5N&no_recurring=0&item_name=I%27m+the+author+of+alive-progress%2C+clearly+and+about-time.+Thank+you+for+appreciating+my+work%21¤cy_code=USD)
---